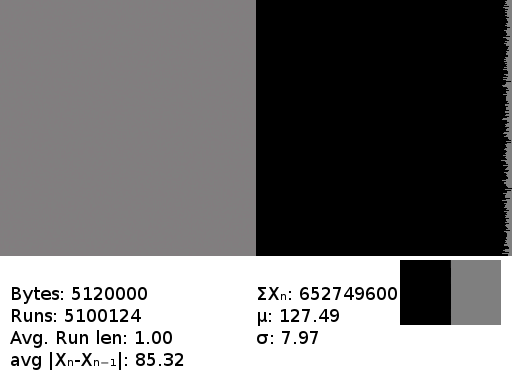
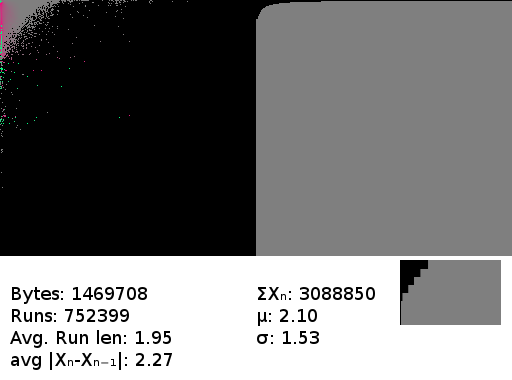
Purely random values. The near-pure grey matrix and roughly level bar chart match in their visual dullness the dullness of the file. There is no obvious pattern to be found here.
File-summary is just a utility that generates a few graphs summarising the statistical properties of a file. These are sufficient to tell a lot about a file's nature, though not precise structure - something of particular use when demonstrating the effect of various transformations or forms of compression.
File-summary graphs are plotted on a per-pixel level of detail - they are intended for getting an overall feel of a file, not precisely reading - and show the most important statistics:
- A correlation matrix for the probability each value of byte is followed by each other value. Grey indicates the 1/256 probability of true random, shades of green a probability greater, red lesser, and black zero.
- A simple bar chart of the relative frequencies of each byte value.
- A chart of the ratios of 1s to 0s for each bit.
- Numerical displays of the file's size, total value of all bytes, mean value, standard deviation, average run length and total value of bytes after delta encoding.
File-summary is distributed as source only. You'll need the magick++ development package installed to compile it. It should be compileable under Windows, but you'll need to alter the hard-coded directory in which it looks for a required font file.
The easiest way to explain the graphs is through some examples
Purely random values. The near-pure grey matrix and roughly level bar chart match in their visual dullness the dullness of the file. There is no obvious pattern to be found here.
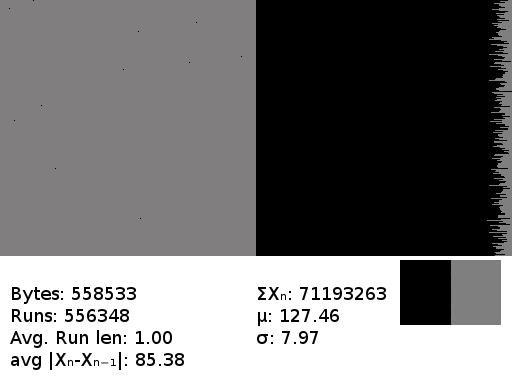
A gnupg encrypted file. Reassuringly indistinguishable from random.
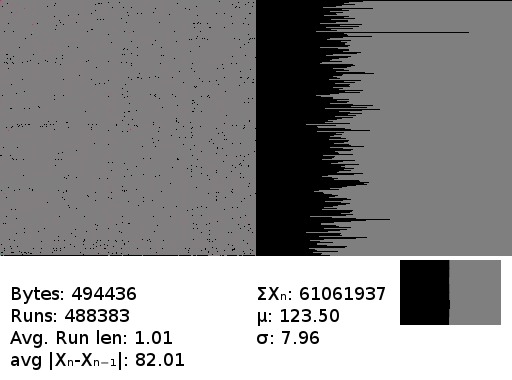
A jpeg. Being compressed data, this looks a lot like random noise - but not quite the same, as can be seen in the frequency graph. Those levels are not close to equal.
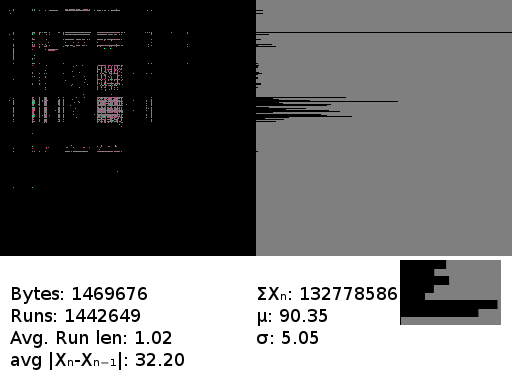
Text, typical english, UTF-8 or ASCII. This shows a lot more color. If you look very closely you can see a few interesting things in the matrix, like the very high probability that 'q' will be followed by 'u' or that '0' will be followed by 'n' or 'h'. The latter confused me - at first I thought it was a flaw in the software, but on inspecting the file I discovered that it had originated with an OCR program that frequently misrecognised 'O' as '0' - and the 'on' and 'oh' pairs appear a lot in English.
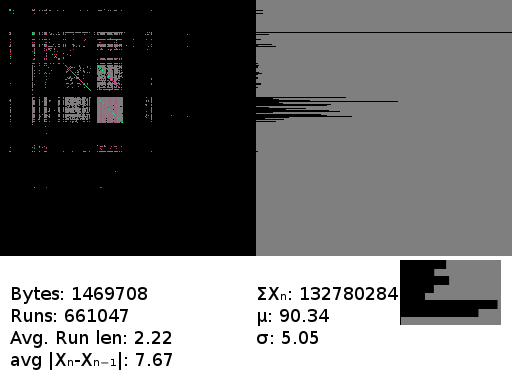
The same text, after processing with the burrows-wheeler transform. Notice the frequency graph is unaltered, as you'd expect from the BWT, but the statistics have now changed greatly. The average run length has doubled. The longer runs can be seen visually too, as the green diagonal line in the matrix. It's also a little longer - the BWT demonstration program I used adds a small header specifying the offset required to recreate the input.
The BWT above followed, as the BWT often is, by move-to-front encoding. Even a brief glance at the frequency graph shows this is going to be favorable to compression - it's composed almost entirely of low-valued bytes.
Paired with file-summary is the transformation toolkit. A small collection of programs I created to demonstrate some of the fundamental algorithms used in data compression. These are not the most efficient, optimised implimentations - there are libraries that do it better. They are rather intended for two purposes:
- Demonstrating the algorithms for educational purposes.
- Testing how a given input will be handled as an aid in deciding how best to compress it.
These programs all accept an input on stdin and output on stdout. They can be chained by pipes, or the output fed into file-summary to generate a graphical description of the output.
The collection impliments the Burrows-Wheeler transform (On arbitary, and possibly very large block sizes), the move-to-front transform and run-length encoding. I also included my 'decapital' transformation, ineffectual as it is in almost all cases.
It's a tangle of untidy C, but the programs are simple and do not deviate from the most basic ANSI C standard, so you should have no trouble compiling them.